HPC
Deploying Prometheus and Grafana in Kubernetes
December 23, 2019
14 min read


The following tutorial is intended to explain the procedure for deploying Prometheus and Grafana in a Kubernetes Cluster.
Prometheus: is an open-source systems monitoring and alerting toolkit.
Grafana: is an open-source metric analytics & visualizing suite. Commonly used for visualizing time series data
You should already have a kubernetes cluster with helm/tiller and a Dynamic NFS Provisioner installed. For instructions on how to set these things up please see the Related Blogs at the bottom of this page. If you have dynamic nfs provisioning setup. You'll need to make sure you have your storage class marked as default.. From the below command we can see that our storage class is not setup as default.
[vagrant@kmaster ~]$ kubectl get storageclass -n kube-system
NAME                  PROVISIONER       AGE
managed-nfs-storage   example.com/nfs   3d16h
If it is not marked as default, you'll need to set the annotation storageclass.kubernetes.io/is-default-class to true. You can do so with the following command.
[vagrant@kmaster ~]$ kubectl patch storageclass managed-nfs-storage -p '{"metadata": {"annotations":{"storageclass.kubernetes.io/is-default-class":"true"}}}'
storageclass.storage.k8s.io/managed-nfs-storage patched
We can see the storageclass is now set to default
[vagrant@kmaster ~]$ kubectl get storageclass -n kube-system
NAME                            PROVISIONER       AGE
managed-nfs-storage (default)   example.com/nfs   3d16h
First we'll need to search the helm repo for a prometheus package
[vagrant@kmaster ~]$ helm search prometheus
NAME                                    CHART VERSION   APP VERSION DESCRIPTION
stable/prometheus                       9.2.0           2.13.1      Prometheus is a monitoring system and time series database.
stable/prometheus-adapter               1.4.0           v0.5.0      A Helm chart for k8s prometheus adapter
stable/prometheus-blackbox-exporter     1.4.0           0.15.1      Prometheus Blackbox Exporter
stable/prometheus-cloudwatch-exporter   0.5.0           0.6.0       A Helm chart for prometheus cloudwatch-exporter
stable/prometheus-consul-exporter       0.1.4           0.4.0       A Helm chart for the Prometheus Consul Exporter
stable/prometheus-couchdb-exporter      0.1.1           1.0         A Helm chart to export the metrics from couchdb in Promet.
Once you've located which chart to download, you can download and edit the values file.
[vagrant@kmaster ~]$ helm inspect values stable/prometheus > /tmp/prometheus.values
Next, we'll need to edit the values file to change the nodeport at which the "Prometheus server service is available. Uncomment the nodePort line and change the port number from 30000 to 32322. Also change where it says ClusterIP to NodePort.
From:
    loadBalancerIP: ""
    loadBalancerSourceRanges: []
    servicePort: 80
    # nodePort: 30000
    type: ClusterIP

To:
    loadBalancerIP: ""
    loadBalancerSourceRanges: []
    servicePort: 80
    nodePort: 32322
    type: NodePort
Once you have updated the values file, you can deploy Prometheus. To deploy Prometheus run the following command.
vagrant@kmaster:~/linux-amd64/nfs-provisioning$ helm install stable/prometheus --name prometheus --values /tmp/prometheus.values --namespace prometheus
NAME:   prometheus
LAST DEPLOYED: Sat Nov  9 21:17:44 2019
NAMESPACE: prometheus
STATUS: DEPLOYED

RESOURCES:
==> v1/ConfigMap
NAME                     AGE
prometheus-alertmanager  1s
prometheus-server        1s

==> v1/DaemonSet
NAME                      AGE
prometheus-node-exporter  1s

==> v1/Deployment
NAME                           AGE
prometheus-alertmanager        1s
prometheus-kube-state-metrics  1s
prometheus-pushgateway         1s
prometheus-server              1s

==> v1/PersistentVolumeClaim
NAME                     AGE
prometheus-alertmanager  1s
prometheus-server        1s

==> v1/Pod(related)
NAME                                           AGE
prometheus-alertmanager-977545d7b-7fdrh        1s
prometheus-kube-state-metrics-dd4fcf989-ht4bb  1s
prometheus-node-exporter-fxj9j                 1s
prometheus-node-exporter-zrmdc                 1s
prometheus-pushgateway-644868fb9c-jns5s        1s
prometheus-server-d6c7dbd-zz4nv                1s

==> v1/Service
NAME                           AGE
prometheus-alertmanager        1s
prometheus-kube-state-metrics  1s
prometheus-node-exporter       1s
prometheus-pushgateway         1s
prometheus-server              1s

==> v1/ServiceAccount
NAME                           AGE
prometheus-alertmanager        1s
prometheus-kube-state-metrics  1s
prometheus-node-exporter       1s
prometheus-pushgateway         1s
prometheus-server              1s

==> v1beta1/ClusterRole
NAME                           AGE
prometheus-alertmanager        1s
prometheus-kube-state-metrics  1s
prometheus-pushgateway         1s
prometheus-server              1s

==> v1beta1/ClusterRoleBinding
NAME                           AGE
prometheus-alertmanager        1s
prometheus-kube-state-metrics  1s
prometheus-pushgateway         1s
prometheus-server              1s


NOTES:
The Prometheus server can be accessed via port 80 on the following DNS name from within your cluster:
prometheus-server.prometheus.svc.cluster.local

Get the Prometheus server URL by running these commands in the same shell:
  export NODE_PORT=$(kubectl get --namespace prometheus -o jsonpath="{.spec.ports[0].nodePort}" services prometheus-server)
  export NODE_IP=$(kubectl get nodes --namespace prometheus -o jsonpath="{.items[0].status.addresses[0].address}")
  echo http://$NODE_IP:$NODE_PORT


The Prometheus alertmanager can be accessed via port 80 on the following DNS name from within your cluster:
prometheus-alertmanager.prometheus.svc.cluster.local


Get the Alertmanager URL by running these commands in the same shell:
  export POD_NAME=$(kubectl get pods --namespace prometheus -l "app=prometheus,component=alertmanager" -o jsonpath="{.items[0].metadata.name}")
  kubectl --namespace prometheus port-forward $POD_NAME 9093
#################################################################################
######   WARNING: Pod Security Policy has been moved to a global property.  #####
######            use .Values.podSecurityPolicy.enabled with pod-based      #####
######            annotations                                               #####
######            (e.g. .Values.nodeExporter.podSecurityPolicy.annotations) #####
#################################################################################


The Prometheus PushGateway can be accessed via port 9091 on the following DNS name from within your cluster:
prometheus-pushgateway.prometheus.svc.cluster.local


Get the PushGateway URL by running these commands in the same shell:
  export POD_NAME=$(kubectl get pods --namespace prometheus -l "app=prometheus,component=pushgateway" -o jsonpath="{.items[0].metadata.name}")
  kubectl --namespace prometheus port-forward $POD_NAME 9091

For more information on running Prometheus, visit:
https://prometheus.io/
We can see that a namespace called Prometheus was created
vagrant@kmaster:~/linux-amd64/nfs-provisioning$ kubectl get ns
NAME              STATUS   AGE
default           Active   44h
kube-node-lease   Active   44h
kube-public       Active   44h
kube-system       Active   44h
prometheus        Active   107s

vagrant@kmaster:~/linux-amd64/nfs-provisioning$ kubectl get all -n prometheus
NAME                                                READY   STATUS    RESTARTS   AGE
pod/prometheus-alertmanager-977545d7b-7fdrh         2/2     Running   0          2m38s
pod/prometheus-kube-state-metrics-dd4fcf989-ht4bb   1/1     Running   0          2m38s
pod/prometheus-node-exporter-fxj9j                  1/1     Running   0          2m38s
pod/prometheus-node-exporter-zrmdc                  1/1     Running   0          2m38s
pod/prometheus-pushgateway-644868fb9c-jns5s         1/1     Running   0          2m38s
pod/prometheus-server-d6c7dbd-zz4nv                 2/2     Running   0          2m38s

NAME                                    TYPE        CLUSTER-IP       EXTERNAL-IP   PORT(S)        AGE
service/prometheus-alertmanager         ClusterIP   10.104.174.230   <none>        80/TCP         2m38s
service/prometheus-kube-state-metrics   ClusterIP   None             <none>        80/TCP         2m38s
service/prometheus-node-exporter        ClusterIP   None             <none>        9100/TCP       2m38s
service/prometheus-pushgateway          ClusterIP   10.98.220.26     <none>        9091/TCP       2m38s
service/prometheus-server               NodePort    10.106.15.8      <none>        80:32322/TCP   2m38s

NAME                                      DESIRED   CURRENT   READY   UP-TO-DATE   AVAILABLE   NODE SELECTOR   AGE
daemonset.apps/prometheus-node-exporter   2         2         2       2            2           <none>          2m38s

NAME                                            READY   UP-TO-DATE   AVAILABLE   AGE
deployment.apps/prometheus-alertmanager         1/1     1            1           2m38s
deployment.apps/prometheus-kube-state-metrics   1/1     1            1           2m38s
deployment.apps/prometheus-pushgateway          1/1     1            1           2m38s
deployment.apps/prometheus-server               1/1     1            1           2m38s

NAME                                                      DESIRED   CURRENT   READY   AGE
replicaset.apps/prometheus-alertmanager-977545d7b         1         1         1       2m38s
replicaset.apps/prometheus-kube-state-metrics-dd4fcf989   1         1         1       2m38s
replicaset.apps/prometheus-pushgateway-644868fb9c         1         1         1       2m38s
replicaset.apps/prometheus-server-d6c7dbd                 1         1         1       2m38s
Now that Prometheus is deployed, we can check the server and see that its running on port 32322
vagrant@kmaster:~/linux-amd64/nfs-provisioning$ kubectl get svc prometheus-server -n prometheus
NAME                TYPE       CLUSTER-IP    EXTERNAL-IP   PORT(S)        AGE
prometheus-server   NodePort   10.106.15.8   <none>        80:32322/TCP   3m14s
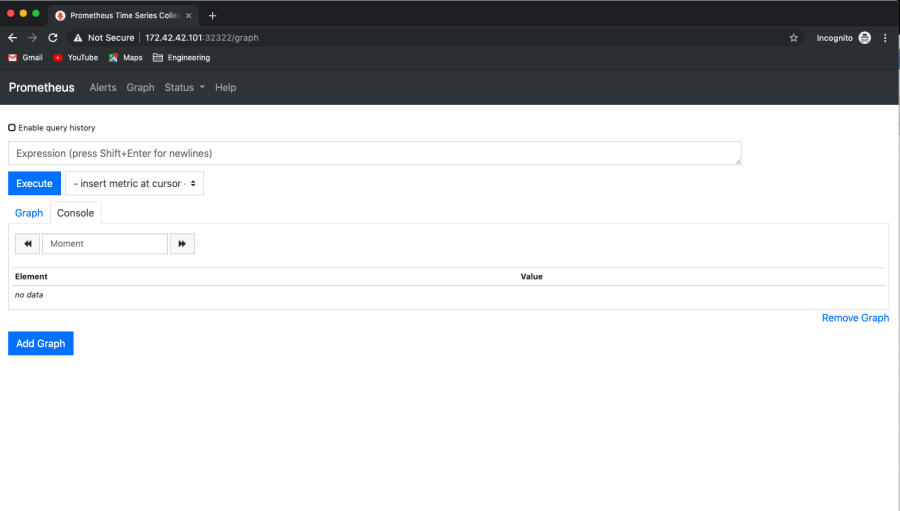
From our browser we should be able to access the Prometheus dashboard from any node on that port: http://<kworker1 IP>:32322
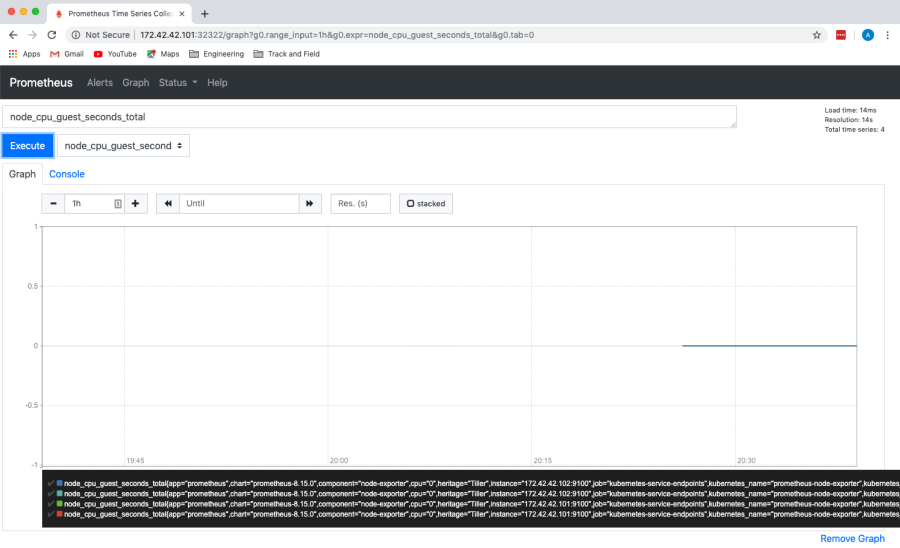
We can choose something to query. Example "node_cpu_guest_second" and click "Execute"
We can use helm search to search for Grafana packages in our package repo. As we can see Grafana has only one package unlike Prometheus which had several.
vagrant@kmaster:~/linux-amd64/nfs-provisioning$ helm search grafana
NAME            CHART VERSION   APP VERSION DESCRIPTION
stable/grafana  4.0.2           6.4.2       The leading tool for querying and visualizing time series...
vagrant@kmaster:~/linux-amd64/nfs-provisioning$
We can download the values file for Grafana
vagrant@kmaster:~/linux-amd64/nfs-provisioning$ helm inspect stable/grafana > /tmp/grafana.values
We can now edit the value file to configure the NodePort type, nodeport Port, enable Persistence and set Administrator credentials to be accessed from outside the cluster.
Edit the /tmp/grafana.values and edit the service to change the type to NodePort.
## Expose the grafana service to be accessed from outside the cluster (LoadBalancer service).
## or access it from within the cluster (ClusterIP service). Set the service type and the port to serve it.
## ref: http://kubernetes.io/docs/user-guide/services/
##
service:
  type: NodePort
  nodePort: 32323
  port: 80
  annotations: {}
  labels: {}
  portName: service
Next, find the "Enable persistence using Persistent Volume Claims" section and change enable: false to true. If we do not do this, the storage volumes that get created automatically when we deploy grafana will be deleted when the pod is terminated. Therefore losing all the saved data.
## Enable persistence using Persistent Volume Claims
## ref: http://kubernetes.io/docs/user-guide/persistent-volumes/
##
persistence:
  enabled: true
  # storageClassName: default
  accessModes:
    - ReadWriteOnce
  size: 10Gi
  # annotations: {}
  # subPath: ""
  # existingClaim:
Next, you can set the admin password. Search for the section that says "Administrator credentials when not using an existing secret", and add your desired password
# Administrator credentials when not using an existing secret (see below)
adminUser: admin
adminPassword: myadminpassword
Next, we're ready to install Grafana using helm
NAME:   grafana
LAST DEPLOYED: Sat Nov  9 22:20:17 2019
NAMESPACE: grafana
STATUS: DEPLOYED

RESOURCES:
==> v1/ClusterRole
NAME                 AGE
grafana-clusterrole  1s

==> v1/ClusterRoleBinding
NAME                        AGE
grafana-clusterrolebinding  1s

==> v1/ConfigMap
NAME          AGE
grafana       1s
grafana-test  1s

==> v1/Deployment
NAME     AGE
grafana  1s

==> v1/PersistentVolumeClaim
NAME     AGE
grafana  1s

==> v1/Pod(related)
NAME                      AGE
grafana-6f978fcd77-rnbcv  1s

==> v1/Role
NAME          AGE
grafana-test  1s

==> v1/RoleBinding
NAME          AGE
grafana-test  1s

==> v1/Secret
NAME     AGE
grafana  1s

==> v1/Service
NAME     AGE
grafana  1s

==> v1/ServiceAccount
NAME          AGE
grafana       1s
grafana-test  1s

==> v1beta1/PodSecurityPolicy
NAME          AGE
grafana       1s
grafana-test  1s

==> v1beta1/Role
NAME     AGE
grafana  1s

==> v1beta1/RoleBinding
NAME     AGE
grafana  1s


NOTES:
1. Get your 'admin' user password by running:

   kubectl get secret --namespace grafana grafana -o jsonpath="{.data.admin-password}" | base64 --decode ; echo

2. The Grafana server can be accessed via port 80 on the following DNS name from within your cluster:

   grafana.grafana.svc.cluster.local

   Get the Grafana URL to visit by running these commands in the same shell:
export NODE_PORT=$(kubectl get --namespace grafana -o jsonpath="{.spec.ports[0].nodePort}" services grafana)
     export NODE_IP=$(kubectl get nodes --namespace grafana -o jsonpath="{.items[0].status.addresses[0].address}")
     echo http://$NODE_IP:$NODE_PORT


3. Login with the password from step 1 and the username: admin
We can check the status of the deployment and see that the deployment is up and running on NodePort: 32323
vagrant@kmaster:~/linux-amd64/nfs-provisioning$ kubectl get all -n grafana
NAME                           READY   STATUS    RESTARTS   AGE
pod/grafana-6f978fcd77-rnbcv   1/1     Running   0          6m13s

NAME              TYPE       CLUSTER-IP       EXTERNAL-IP   PORT(S)        AGE
service/grafana   NodePort   10.106.143.208   <none>        80:32323/TCP   6m13s

NAME                      READY   UP-TO-DATE   AVAILABLE   AGE
deployment.apps/grafana   1/1     1            1           6m13s

NAME                                 DESIRED   CURRENT   READY   AGE
replicaset.apps/grafana-6f978fcd77   1         1         1       6m13s
If we run "kubectl get pvc" we can see that storage was dynamically allocated for grafana.
vagrant@kmaster:~/linux-amd64/nfs-provisioning$ kubectl get pvc -n grafana
NAME      STATUS   VOLUME                                     CAPACITY   ACCESS MODES   STORAGECLASS          AGE
grafana   Bound    pvc-2843ccf2-aec9-45f9-ac65-a3afa1c2f716   10Gi       RWO            managed-nfs-storage   3m12s
And, if we take a look under /srv/nfs/kubedata, we can see the volume that was created.
vagrant@kmaster:~/linux-amd64/nfs-provisioning$ ls -l /srv/nfs/kubedata/
total 12
drwxrwxrwx 4  472  472 4096 Nov  9 22:20 grafana-grafana-pvc-2843ccf2-aec9-45f9-ac65-a3afa1c2f716
drwxrwxrwx 2 root root 4096 Nov  9 22:18 prometheus-prometheus-alertmanager-pvc-55eea2a0-6bf6-45a6-932e-4cdd86504854
drwxrwxrwx 3 root root 4096 Nov  9 21:18 prometheus-prometheus-server-pvc-657076e7-9ed9-44a5-8aaf-dc6f28918414
If we check the pods with kubectl get pods, in the grafana namespace and use the "-o wide" option, we can see that the kubernetes grafana pod is running on kworker1
vagrant@kmaster:~/linux-amd64/nfs-provisioning$ kubectl get pods -n grafana -o wide
NAME                       READY   STATUS    RESTARTS   AGE     IP               NODE       NOMINATED NODE   READINESS GATES
grafana-6f978fcd77-rnbcv   1/1     Running   0          7m53s   192.168.41.134   kworker1   <none>           <none>
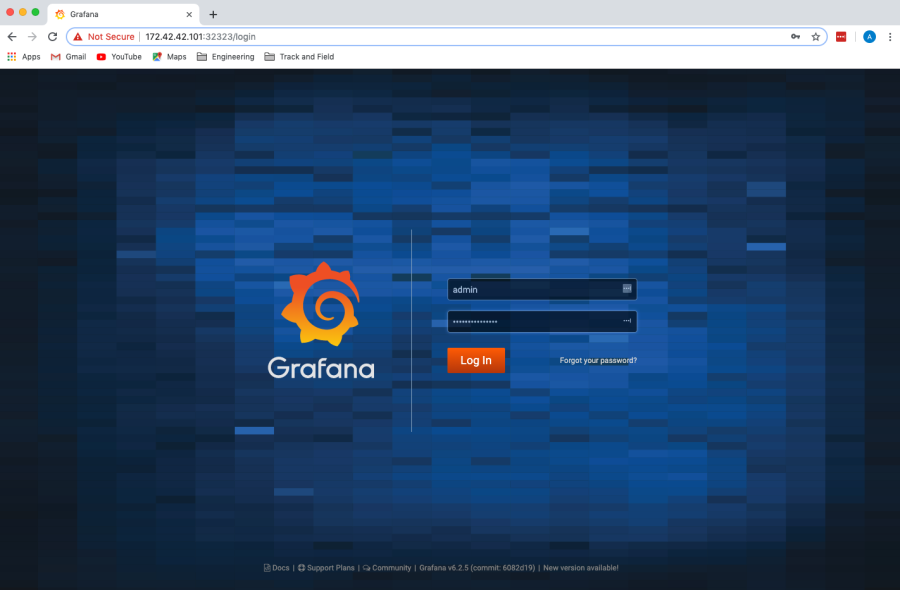
To access the Dashboard from your browser type http://<ip-to-kworker1>:32323. You can log in with the admin user, using the password you set in the grafana.values file.
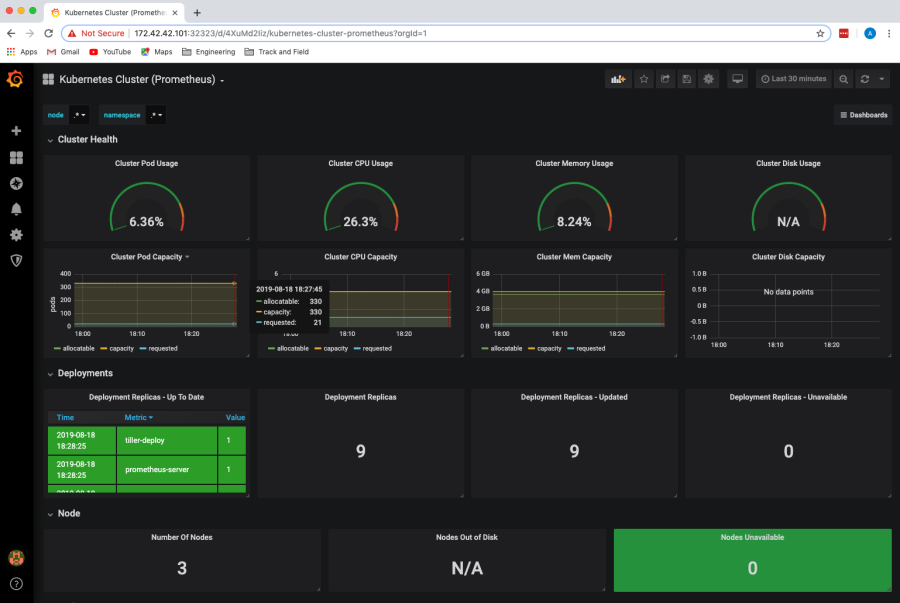
Once logged in you create a dashboard using the Prometheus Data Source or import an existing one.
Note: When deleting Prometheus remember to delete the pods, services, replica sets and deployments for a clean delete
kubectl delete pods --all -n prometheus
kubectl delete replicaset --all -n prometheus
kubectl delete deployment --all -n prometheus
kubectl delete svc --all -n prometheus
kubectl delete daemonset --all -n Prometheus
kubectl get all -n prometheus
helm delete prometheus --purge
 kubectl delete -n prometheus
To learn more about Kubernets and Grafana visit: "What is Grafana and Why Use It"
Related Blogs

The following tutorial is intended to explain the procedure for deploying Prometheus and Grafana in a Kubernetes Cluster.
Prometheus: is an open-source systems monitoring and alerting toolkit.
Grafana: is an open-source metric analytics & visualizing suite. Commonly used for visualizing time series data
You should already have a kubernetes cluster with helm/tiller and a Dynamic NFS Provisioner installed. For instructions on how to set these things up please see the Related Blogs at the bottom of this page. If you have dynamic nfs provisioning setup. You'll need to make sure you have your storage class marked as default.. From the below command we can see that our storage class is not setup as default.
[vagrant@kmaster ~]$ kubectl get storageclass -n kube-system
NAME                  PROVISIONER       AGE
managed-nfs-storage   example.com/nfs   3d16h
If it is not marked as default, you'll need to set the annotation storageclass.kubernetes.io/is-default-class to true. You can do so with the following command.
[vagrant@kmaster ~]$ kubectl patch storageclass managed-nfs-storage -p '{"metadata": {"annotations":{"storageclass.kubernetes.io/is-default-class":"true"}}}'
storageclass.storage.k8s.io/managed-nfs-storage patched
We can see the storageclass is now set to default
[vagrant@kmaster ~]$ kubectl get storageclass -n kube-system
NAME                            PROVISIONER       AGE
managed-nfs-storage (default)   example.com/nfs   3d16h
First we'll need to search the helm repo for a prometheus package
[vagrant@kmaster ~]$ helm search prometheus
NAME                                    CHART VERSION   APP VERSION DESCRIPTION
stable/prometheus                       9.2.0           2.13.1      Prometheus is a monitoring system and time series database.
stable/prometheus-adapter               1.4.0           v0.5.0      A Helm chart for k8s prometheus adapter
stable/prometheus-blackbox-exporter     1.4.0           0.15.1      Prometheus Blackbox Exporter
stable/prometheus-cloudwatch-exporter   0.5.0           0.6.0       A Helm chart for prometheus cloudwatch-exporter
stable/prometheus-consul-exporter       0.1.4           0.4.0       A Helm chart for the Prometheus Consul Exporter
stable/prometheus-couchdb-exporter      0.1.1           1.0         A Helm chart to export the metrics from couchdb in Promet.
Once you've located which chart to download, you can download and edit the values file.
[vagrant@kmaster ~]$ helm inspect values stable/prometheus > /tmp/prometheus.values
Next, we'll need to edit the values file to change the nodeport at which the "Prometheus server service is available. Uncomment the nodePort line and change the port number from 30000 to 32322. Also change where it says ClusterIP to NodePort.
From:
    loadBalancerIP: ""
    loadBalancerSourceRanges: []
    servicePort: 80
    # nodePort: 30000
    type: ClusterIP

To:
    loadBalancerIP: ""
    loadBalancerSourceRanges: []
    servicePort: 80
    nodePort: 32322
    type: NodePort
Once you have updated the values file, you can deploy Prometheus. To deploy Prometheus run the following command.
vagrant@kmaster:~/linux-amd64/nfs-provisioning$ helm install stable/prometheus --name prometheus --values /tmp/prometheus.values --namespace prometheus
NAME:   prometheus
LAST DEPLOYED: Sat Nov  9 21:17:44 2019
NAMESPACE: prometheus
STATUS: DEPLOYED

RESOURCES:
==> v1/ConfigMap
NAME                     AGE
prometheus-alertmanager  1s
prometheus-server        1s

==> v1/DaemonSet
NAME                      AGE
prometheus-node-exporter  1s

==> v1/Deployment
NAME                           AGE
prometheus-alertmanager        1s
prometheus-kube-state-metrics  1s
prometheus-pushgateway         1s
prometheus-server              1s

==> v1/PersistentVolumeClaim
NAME                     AGE
prometheus-alertmanager  1s
prometheus-server        1s

==> v1/Pod(related)
NAME                                           AGE
prometheus-alertmanager-977545d7b-7fdrh        1s
prometheus-kube-state-metrics-dd4fcf989-ht4bb  1s
prometheus-node-exporter-fxj9j                 1s
prometheus-node-exporter-zrmdc                 1s
prometheus-pushgateway-644868fb9c-jns5s        1s
prometheus-server-d6c7dbd-zz4nv                1s

==> v1/Service
NAME                           AGE
prometheus-alertmanager        1s
prometheus-kube-state-metrics  1s
prometheus-node-exporter       1s
prometheus-pushgateway         1s
prometheus-server              1s

==> v1/ServiceAccount
NAME                           AGE
prometheus-alertmanager        1s
prometheus-kube-state-metrics  1s
prometheus-node-exporter       1s
prometheus-pushgateway         1s
prometheus-server              1s

==> v1beta1/ClusterRole
NAME                           AGE
prometheus-alertmanager        1s
prometheus-kube-state-metrics  1s
prometheus-pushgateway         1s
prometheus-server              1s

==> v1beta1/ClusterRoleBinding
NAME                           AGE
prometheus-alertmanager        1s
prometheus-kube-state-metrics  1s
prometheus-pushgateway         1s
prometheus-server              1s


NOTES:
The Prometheus server can be accessed via port 80 on the following DNS name from within your cluster:
prometheus-server.prometheus.svc.cluster.local

Get the Prometheus server URL by running these commands in the same shell:
  export NODE_PORT=$(kubectl get --namespace prometheus -o jsonpath="{.spec.ports[0].nodePort}" services prometheus-server)
  export NODE_IP=$(kubectl get nodes --namespace prometheus -o jsonpath="{.items[0].status.addresses[0].address}")
  echo http://$NODE_IP:$NODE_PORT


The Prometheus alertmanager can be accessed via port 80 on the following DNS name from within your cluster:
prometheus-alertmanager.prometheus.svc.cluster.local


Get the Alertmanager URL by running these commands in the same shell:
  export POD_NAME=$(kubectl get pods --namespace prometheus -l "app=prometheus,component=alertmanager" -o jsonpath="{.items[0].metadata.name}")
  kubectl --namespace prometheus port-forward $POD_NAME 9093
#################################################################################
######   WARNING: Pod Security Policy has been moved to a global property.  #####
######            use .Values.podSecurityPolicy.enabled with pod-based      #####
######            annotations                                               #####
######            (e.g. .Values.nodeExporter.podSecurityPolicy.annotations) #####
#################################################################################


The Prometheus PushGateway can be accessed via port 9091 on the following DNS name from within your cluster:
prometheus-pushgateway.prometheus.svc.cluster.local


Get the PushGateway URL by running these commands in the same shell:
  export POD_NAME=$(kubectl get pods --namespace prometheus -l "app=prometheus,component=pushgateway" -o jsonpath="{.items[0].metadata.name}")
  kubectl --namespace prometheus port-forward $POD_NAME 9091

For more information on running Prometheus, visit:
https://prometheus.io/
We can see that a namespace called Prometheus was created
vagrant@kmaster:~/linux-amd64/nfs-provisioning$ kubectl get ns
NAME              STATUS   AGE
default           Active   44h
kube-node-lease   Active   44h
kube-public       Active   44h
kube-system       Active   44h
prometheus        Active   107s
vagrant@kmaster:~/linux-amd64/nfs-provisioning$ kubectl get all -n prometheus
NAME                                                READY   STATUS    RESTARTS   AGE
pod/prometheus-alertmanager-977545d7b-7fdrh         2/2     Running   0          2m38s
pod/prometheus-kube-state-metrics-dd4fcf989-ht4bb   1/1     Running   0          2m38s
pod/prometheus-node-exporter-fxj9j                  1/1     Running   0          2m38s
pod/prometheus-node-exporter-zrmdc                  1/1     Running   0          2m38s
pod/prometheus-pushgateway-644868fb9c-jns5s         1/1     Running   0          2m38s
pod/prometheus-server-d6c7dbd-zz4nv                 2/2     Running   0          2m38s

NAME                                    TYPE        CLUSTER-IP       EXTERNAL-IP   PORT(S)        AGE
service/prometheus-alertmanager         ClusterIP   10.104.174.230   <none>        80/TCP         2m38s
service/prometheus-kube-state-metrics   ClusterIP   None             <none>        80/TCP         2m38s
service/prometheus-node-exporter        ClusterIP   None             <none>        9100/TCP       2m38s
service/prometheus-pushgateway          ClusterIP   10.98.220.26     <none>        9091/TCP       2m38s
service/prometheus-server               NodePort    10.106.15.8      <none>        80:32322/TCP   2m38s

NAME                                      DESIRED   CURRENT   READY   UP-TO-DATE   AVAILABLE   NODE SELECTOR   AGE
daemonset.apps/prometheus-node-exporter   2         2         2       2            2           <none>          2m38s

NAME                                            READY   UP-TO-DATE   AVAILABLE   AGE
deployment.apps/prometheus-alertmanager         1/1     1            1           2m38s
deployment.apps/prometheus-kube-state-metrics   1/1     1            1           2m38s
deployment.apps/prometheus-pushgateway          1/1     1            1           2m38s
deployment.apps/prometheus-server               1/1     1            1           2m38s

NAME                                                      DESIRED   CURRENT   READY   AGE
replicaset.apps/prometheus-alertmanager-977545d7b         1         1         1       2m38s
replicaset.apps/prometheus-kube-state-metrics-dd4fcf989   1         1         1       2m38s
replicaset.apps/prometheus-pushgateway-644868fb9c         1         1         1       2m38s
replicaset.apps/prometheus-server-d6c7dbd                 1         1         1       2m38s
Now that Prometheus is deployed, we can check the server and see that its running on port 32322
vagrant@kmaster:~/linux-amd64/nfs-provisioning$ kubectl get svc prometheus-server -n prometheus
NAME                TYPE       CLUSTER-IP    EXTERNAL-IP   PORT(S)        AGE
prometheus-server   NodePort   10.106.15.8   <none>        80:32322/TCP   3m14s
From our browser we should be able to access the Prometheus dashboard from any node on that port: http://<kworker1 IP>:32322
We can choose something to query. Example "node_cpu_guest_second" and click "Execute"
We can use helm search to search for Grafana packages in our package repo. As we can see Grafana has only one package unlike Prometheus which had several.
vagrant@kmaster:~/linux-amd64/nfs-provisioning$ helm search grafana
NAME            CHART VERSION   APP VERSION DESCRIPTION
stable/grafana  4.0.2           6.4.2       The leading tool for querying and visualizing time series...
vagrant@kmaster:~/linux-amd64/nfs-provisioning$
We can download the values file for Grafana
vagrant@kmaster:~/linux-amd64/nfs-provisioning$ helm inspect stable/grafana > /tmp/grafana.values
We can now edit the value file to configure the NodePort type, nodeport Port, enable Persistence and set Administrator credentials to be accessed from outside the cluster.
Edit the /tmp/grafana.values and edit the service to change the type to NodePort.
## Expose the grafana service to be accessed from outside the cluster (LoadBalancer service).
## or access it from within the cluster (ClusterIP service). Set the service type and the port to serve it.
## ref: http://kubernetes.io/docs/user-guide/services/
##
service:
  type: NodePort
  nodePort: 32323
  port: 80
  annotations: {}
  labels: {}
  portName: service
Next, find the "Enable persistence using Persistent Volume Claims" section and change enable: false to true. If we do not do this, the storage volumes that get created automatically when we deploy grafana will be deleted when the pod is terminated. Therefore losing all the saved data.
## Enable persistence using Persistent Volume Claims
## ref: http://kubernetes.io/docs/user-guide/persistent-volumes/
##
persistence:
  enabled: true
  # storageClassName: default
  accessModes:
    - ReadWriteOnce
  size: 10Gi
  # annotations: {}
  # subPath: ""
  # existingClaim:
Next, you can set the admin password. Search for the section that says "Administrator credentials when not using an existing secret", and add your desired password
# Administrator credentials when not using an existing secret (see below)
adminUser: admin
adminPassword: myadminpassword
Next, we're ready to install Grafana using helm
NAME:   grafana
LAST DEPLOYED: Sat Nov  9 22:20:17 2019
NAMESPACE: grafana
STATUS: DEPLOYED

RESOURCES:
==> v1/ClusterRole
NAME                 AGE
grafana-clusterrole  1s

==> v1/ClusterRoleBinding
NAME                        AGE
grafana-clusterrolebinding  1s

==> v1/ConfigMap
NAME          AGE
grafana       1s
grafana-test  1s

==> v1/Deployment
NAME     AGE
grafana  1s

==> v1/PersistentVolumeClaim
NAME     AGE
grafana  1s

==> v1/Pod(related)
NAME                      AGE
grafana-6f978fcd77-rnbcv  1s

==> v1/Role
NAME          AGE
grafana-test  1s

==> v1/RoleBinding
NAME          AGE
grafana-test  1s

==> v1/Secret
NAME     AGE
grafana  1s

==> v1/Service
NAME     AGE
grafana  1s

==> v1/ServiceAccount
NAME          AGE
grafana       1s
grafana-test  1s

==> v1beta1/PodSecurityPolicy
NAME          AGE
grafana       1s
grafana-test  1s

==> v1beta1/Role
NAME     AGE
grafana  1s

==> v1beta1/RoleBinding
NAME     AGE
grafana  1s


NOTES:
1. Get your 'admin' user password by running:

   kubectl get secret --namespace grafana grafana -o jsonpath="{.data.admin-password}" | base64 --decode ; echo

2. The Grafana server can be accessed via port 80 on the following DNS name from within your cluster:

   grafana.grafana.svc.cluster.local

   Get the Grafana URL to visit by running these commands in the same shell:
export NODE_PORT=$(kubectl get --namespace grafana -o jsonpath="{.spec.ports[0].nodePort}" services grafana)
     export NODE_IP=$(kubectl get nodes --namespace grafana -o jsonpath="{.items[0].status.addresses[0].address}")
     echo http://$NODE_IP:$NODE_PORT


3. Login with the password from step 1 and the username: admin
We can check the status of the deployment and see that the deployment is up and running on NodePort: 32323
vagrant@kmaster:~/linux-amd64/nfs-provisioning$ kubectl get all -n grafana
NAME                           READY   STATUS    RESTARTS   AGE
pod/grafana-6f978fcd77-rnbcv   1/1     Running   0          6m13s

NAME              TYPE       CLUSTER-IP       EXTERNAL-IP   PORT(S)        AGE
service/grafana   NodePort   10.106.143.208   <none>        80:32323/TCP   6m13s

NAME                      READY   UP-TO-DATE   AVAILABLE   AGE
deployment.apps/grafana   1/1     1            1           6m13s

NAME                                 DESIRED   CURRENT   READY   AGE
replicaset.apps/grafana-6f978fcd77   1         1         1       6m13s
If we run "kubectl get pvc" we can see that storage was dynamically allocated for grafana.
vagrant@kmaster:~/linux-amd64/nfs-provisioning$ kubectl get pvc -n grafana
NAME      STATUS   VOLUME                                     CAPACITY   ACCESS MODES   STORAGECLASS          AGE
grafana   Bound    pvc-2843ccf2-aec9-45f9-ac65-a3afa1c2f716   10Gi       RWO            managed-nfs-storage   3m12s
And, if we take a look under /srv/nfs/kubedata, we can see the volume that was created.
vagrant@kmaster:~/linux-amd64/nfs-provisioning$ ls -l /srv/nfs/kubedata/
total 12
drwxrwxrwx 4  472  472 4096 Nov  9 22:20 grafana-grafana-pvc-2843ccf2-aec9-45f9-ac65-a3afa1c2f716
drwxrwxrwx 2 root root 4096 Nov  9 22:18 prometheus-prometheus-alertmanager-pvc-55eea2a0-6bf6-45a6-932e-4cdd86504854
drwxrwxrwx 3 root root 4096 Nov  9 21:18 prometheus-prometheus-server-pvc-657076e7-9ed9-44a5-8aaf-dc6f28918414
If we check the pods with kubectl get pods, in the grafana namespace and use the "-o wide" option, we can see that the kubernetes grafana pod is running on kworker1
vagrant@kmaster:~/linux-amd64/nfs-provisioning$ kubectl get pods -n grafana -o wide
NAME                       READY   STATUS    RESTARTS   AGE     IP               NODE       NOMINATED NODE   READINESS GATES
grafana-6f978fcd77-rnbcv   1/1     Running   0          7m53s   192.168.41.134   kworker1   <none>           <none>
To access the Dashboard from your browser type http://<ip-to-kworker1>:32323. You can log in with the admin user, using the password you set in the grafana.values file.
Once logged in you create a dashboard using the Prometheus Data Source or import an existing one.
Note: When deleting Prometheus remember to delete the pods, services, replica sets and deployments for a clean delete
kubectl delete pods --all -n prometheus
kubectl delete replicaset --all -n prometheus
kubectl delete deployment --all -n prometheus
kubectl delete svc --all -n prometheus
kubectl delete daemonset --all -n Prometheus
kubectl get all -n prometheus
helm delete prometheus --purge
 kubectl delete -n prometheus
To learn more about Kubernets and Grafana visit: "What is Grafana and Why Use It"
Related Blogs